This course will give you a deep understanding from basic to advanced Excel formulas and functions that transform Excel from a basic spreadsheet program into a dynamic and powerful analytics tool.
Enter into the training that outplays all mainstream training systems. Learn by practicing real life business scenarios.
While most Excel courses focus on simply what each formula does, I teach through hands-on, contextual examples designed to showcase why these formulas are awesome and how they can be applied in a number of ways. I will not train you to regurgitate functions and formula syntax; I will teach you how to THINK like Excel.
By the end of the course, you will be writing robust, elegant formulas from scratch, allowing you to:
- Easily build dynamic tools & Excel dashboards to filter, display and analyze your data.
- Create your own formula-based Excel formatting rules.
- Join datasets from multiple sources with XLOOKUP, INDEX & MATCH functions.
- Learn advanced Excel formulas such as SORT, FILTER, LEN
- Manipulate dates, times, text, and arrays.
- Automate tedious and time-consuming tasks using cell formulas and functions in Excel (no VBA required!).
- Perform advanced data analysis using Pivot Table.
- Learn how to clean, modify, and design data using Power Query.
- Learn the advanced tools such as developer tools form control, what-if analysis, goal seek, solver and scenario planning.
- Learn to create real life reports with industry data.
Who this course is for:
- Anyone who is looking for a hands-on course on MS Excel.
- Excel users who want to learn how to write advanced formulas from scratch.
- Anyone hoping to expand their analytics skill set, work efficiently with data, and take their career to a new level.
- Excel users hoping to discover new tools to help them do more in less time.
- Business professionals looking to become more confident in Excel.
- Students looking for an engaging, hands-on, and highly interactive approach to Excel analytics training.
- Excel users looking to build powerful analytical thinking and business intelligence skills.
- Anyone expecting to learn advanced techniques to create and manage reports for HR, Sales, Marketing, Production, Finance and Accounts departments.
- Officers / Executives / Managers of different organizations who want to increase their Excel knowledge.
What will i learn?
- Build a solid understanding on the Basics of Microsoft Excel.
- Learn the most common Excel functions used in the office.
- Master Microsoft Excel from Beginner to Advanced.
- Maintain large sets of Excel data in a list or table.
- Unlock dynamic formulas with SORT, FILTER, CHOSSE, IF, VLOOKUP, INDEX, MATCH functions and many more.
- Learn to write advanced formulas by combining two or more Excel formulas.
- Use the NEW dynamic array functions to perform tasks.
- Link to other worksheets & workbooks and protect & sharing workbooks.
- Create dynamic reports by mastering one of the most popular tools: PivotTable.
- Use Goal Seek, Scenario Manager, and Solver to fill data gaps in Excel.
- Learn to use logical functions to make better business decisions.
- Learn to use Power Query and Power Pivot for advanced data analysis.
- Create a Sales Dashboard from scratch.
- Work with 10+ live projects to create attractive reports.
- Access to a Professional Accountant for future support.
- No Prior Excel Knowledge Required
- Microsoft Excel 2021 or 365 software in your system
- Computer and internet access required
- Willingness to learn and practice Excel
- Module 1: Getting Started with Excel
- Module 2: Data Entry, Data Editing, and Number Formatting
- Module 3: Data Formatting
- Module 4: Working with Cells and Ranges in Excel
- Module 5: Managing Worksheets
- Module 6: Creating and Managing Excel Tables
- Module 7: Getting Started with Excel Formulae
- Module 8: Logical Formulae in Excel
- Module 9: Math Formulae in Excel
- Module 10: Lookup and Reference Formulae in Excel
- Module 11: Statistical Formulae in Excel
- Module 12: Text Formulae in Excel
- Module 13: Date and Time Formulae in Excel
- Module 14: Practice with Most Essential Excel Formulae
- Module 15: Name Ranges and Data Validation in Excel
- Module 16: Data Sorting and Filtering in Excel
- Module 17: Conditional Formatting in Excel
- Module 18: Excel Charts
- Module 19: Other Excel Essentials
- Convert Data Range / Table to Pivot Table
- Understanding of Pivot Table Fields (Filters, Columns, Rows & Values)
- Pivot Table Analyze Option
- Slicer and Timeline
- Change Source Data
- Hide/Unhide Field Lists, Buttons & Field Headers
- Subtotals and Grand Totals in Pivot Table
- Change Report Layout in Pivot Table
- Insertion and Removal of Blank Rows in Pivot Table
- Pivot Table Stylish Options
- Create a Custom PivotTable Style
- Apply Custom Number Formatting
- Sort Using Custom Lists
- Apply Multiple Filters to Data
- Adjust Slicer Settings
- Lock Workbooks without Locking Slicers
- Create Calculated Field
- Create Calculated Item
- Solver Order
- Use of GETPIVOTDATA Formula
- Use GETPIVOTDATA for Dependent Data Validation Lists
- Create Dynamic Pivot Chart Title
- Add Dynamic Series to a Pivot Chart
- Add Totals to a Stacked Column Chart
- Combine Data from Multiple Tables
- What are dynamic arrays?
- Filter Formula with Multiple Conditions
- Sortby Formula with Multiple Conditions
- Extract and Count Unique Filters
- Unique vs. Distinct
- Unique with Multiple Criteria
- Extract Unique Values by Column
- SORT Function & Horizontal SORT
- SORYBY Function & Horizontal SORTBY
- SEQUENCE and Unstacking Records
- Filter Formula with Multiple Conditions
- Using RANDARRAY and RANDBETWEEN to Randomize Data
- Using XLOOKUP to Perform Complex Lookups
- Using XMATCH
Module 23: Excel Advanced Functions for Complex Analysis
- 2-Way Lookup Using INDEX-MATCH and Double XLOOKUP Functions
- Advanced Lookup Using CHOOSE Function
- Create Quarters from Dates using CHOOSE, TEXT & Month Functions
- MEDIAN, MODE.SNGL and MODE.MULT
- LARGE and SMALL
- Ranking Data with Sorting using RANK.EQ and RANK.AVG
- AGGREGATE Function
- LET and LAMBDA Functions
- VSTACK and HSTACK Functions
- Advanced Filter Option to Replace Lookup Functions
- SUMIFS Function with Dates, Sum Month & Sum with Multiple Criterion
- SUM by Matching Partial Values/Texts in Excel
- Extract Values using IF Function with PARTIAL Text Match
- Dynamic Searchable Dropdown Menu in Excel
- Create Gauge Chart
- Create Milestone Chart
- Create Gantt Chart
- Create Actual vs Target Chart using Upside & Downside Arrow
- Create Actual vs Target Chart using Target Column in Transparent View
- Dynamic Error Bar Chart
- Use of Goal Seek
- Use of Scenario Manager
- Use of Solver
- Use of Data Analysis
- Introduction to Form Controls
- Combo Box - Select from a List
- Check Box - CheckUncheck Option
- Option Button - Choose an Option
- Spin Button - Move Up and Down a List
- List Box - Select from a List of Items
- Scroll Bar - Scroll Through a List
- Introduction to Power Query
- Getting to Know Power Query in Excel
- Exploring Excel's Power Query Editor
- Power Query Data Loading Options
- Applying Basic Table Transformations with Power Query
- Power Query TRANSFORM vs ADD COLUMN Functions
- Power Query Text Tools
- Power Query Number & Value Tools
- Power Query Date & Time Tools
- Generate Index & Conditional Columns
- Grouping & Aggregating Records
- Pivoting & Unpivoting Data
- Modifying Excel Workbook Queries
- Merge Queries with Power Query
- Append Queries with Power Query
- Connect Power Query to a Folder of Files
- Preform Accounts Receivable Analysis (Aged Receivable Days, Bad Debt) etc.
- Prepare Sales Collection & Credit Report
- Design Excel Sheet to Automate TDS & VDS Calculation from Bill Payments
- Calculate Employees' Taxes from Salary Sheet
- Perform Customer Segment and Profitability Analysis
- Prepare Report for Top 10 and Worst 10 Selling Products
- Prepare Divisions' and Products Wise Sales Report
- Design a Dashboard with Excel Pivot Table

MD. Morshedul Alam ACMA
Corporate professional with more than 7 years of experience in costing, cash flow planning, budgeting, financial reporting, internal auditing and business analytics. He is a qualified Cost and Management Accountant (CMA) from ICMAB. He has adequate knowledge of advance excel and Power BI to formulate complex financial models, dashboards and analytics. Also, he is founder and chief content creator of Analyst Skill.
IAS IFRS Financial Modeling Financial Reporting Costing Cost Control Budgeting Financial Analysis Excel Power BI Analytics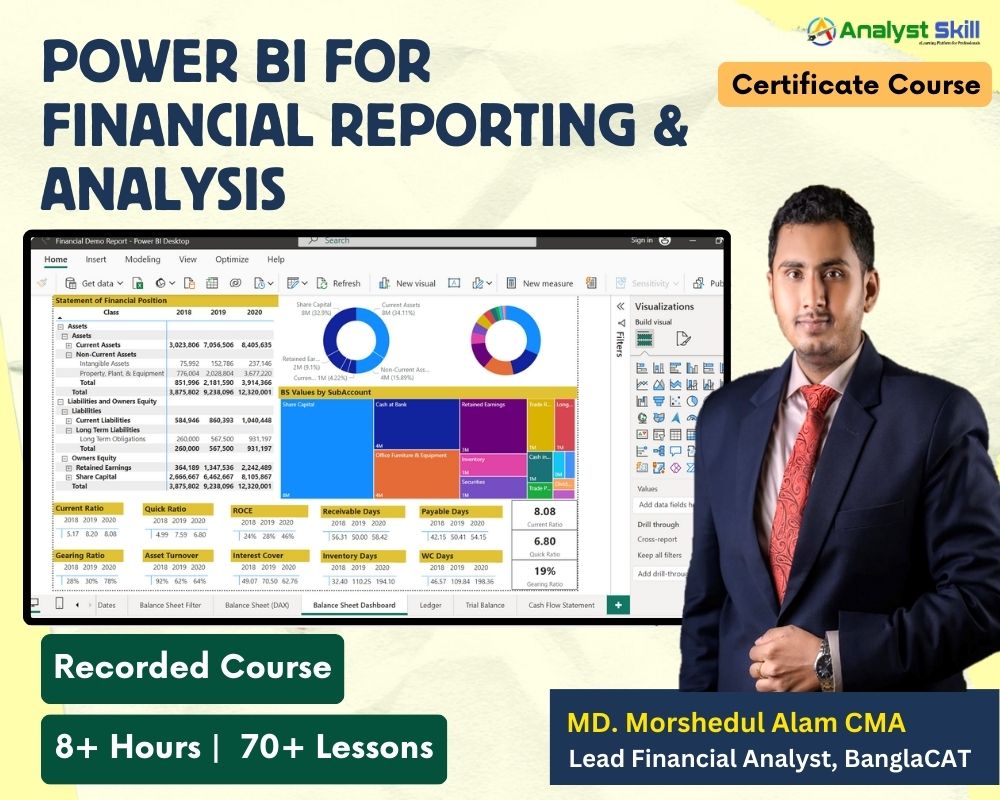


- কোর্সটি করে আপনি ভেরিফাইড সার্টিফিকেট পারবেন যা আপনিঃ
- আপনার সিভিতে যোগ করতে পারবেন।
- লিংকডইন প্রোফাইলে এড করতে পারবেন।
- বিডিজবস এর প্রোফাইলে এটাচ করতে পারবেন।
Course Reviews & Ratings(4.73 Out of 5.00)


To stay connect with us and get regular updates, follow our official Facebook page and join our groups:
Office YouTube Channel: Analyst Skill
Click To Join Our YouTube ChannelOfficial Facebook Group: Career for Business Professionals
Click To Join Our Facebook GroupOfficial Facebook Page: Analyst Skill
Click To Join Our Facebook PageOfficial LinkedIn Page: Analyst Skill
Click To Join Our LinkedIn PageStill Have Any Confusion

Write a public review